Visualizing solar capacity, performance across the US
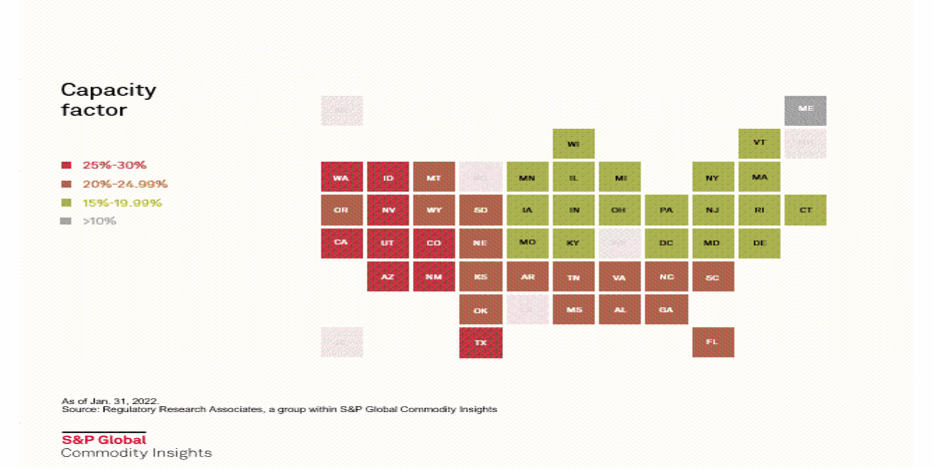
Solar capacity factors rose across all independent system operators in 2020, pushing the weighted U.S. average up 1.8 percentage points year over year as more than three-quarters of the states housing utility-scale solar projects experienced increases.
The 2020 weighted U.S. solar capacity factor comes in at a calculated 24.4%, based on S&P Global Commodity Insights estimates. The California ISO tops the ISO leaderboard at nearly 27%, but Utah leads the pack across state lines, with solar plants in the Beehive State averaging almost 30%. Wisconsin, meanwhile, logged the largest gains from 2019 to 2020, up an estimated 8.6 percentage points.
Click here to read the full article
Source: S&P Global
—
If you have any questions or thoughts about the topic, feel free to contact us here or leave a comment below.


Leave a Reply
Want to join the discussion?Feel free to contribute!