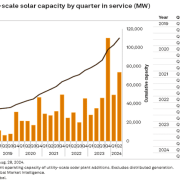
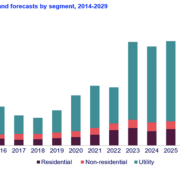
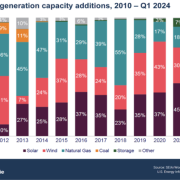
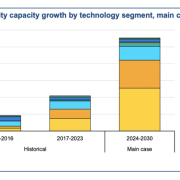
For the first time in history, solar accounts for over 50% of new electricity capacity added to the grid..

The U.S. solar industry added a record-shattering 32.4 gigawatts (GW) of new electric generating capacity in 2023, a 37% increase from the previous record set in 2021 and a 51% increase from 2022.

According to the U.S. Solar Market Insight 2023 Year in Review released today by the Solar Energy Industries Association (SEIA) and Wood Mackenzie, solar accounts for 53% of all new electric generating capacity added to the grid last year. This marks the first time in 80 years that a renewable electricity source has accounted for over 50% of annual capacity additions.

Click here to read the full article
Source: SEIA

If you have any questions or thoughts about the topic, feel free to contact us here or leave a comment below.

Developers and power plant owners plan to add 62.8 gigawatts (GW) of new utility-scale electric-generating capacity in 2024.

Developers and power plant owners plan to add 62.8 gigawatts (GW) of new utility-scale electric-generating capacity in 2024, according to our latest Preliminary Monthly Electric Generator Inventory. This addition would be 55% more added capacity than the 40.4 GW added in 2023 (the most since 2003) and points to a continued rise in industry activity. We expect solar to account for the largest share of new capacity in 2024, at 58%, followed by battery storage, at 23%.

Solar. We expect a record addition of utility-scale solar in 2024 if the scheduled 36.4 GW are added to the grid. This growth would almost double last year’s 18.4 GW increase, which was itself a record for annual utility-scale solar installation in the United States. As the effects of supply chain challenges and trade restrictions ease, solar continues to outpace capacity additions from other generating resources.

Click here to read the full article
Source: EIA.gov

If you have any questions or thoughts about the topic, feel free to contact us here or leave a comment below.

The global floating solar panel market is estimated to grow at a CAGR of 27.57% to reach US$2, 797.556M in 2028 from US$508.809M in 2021.

The global floating solar panel market is estimated to grow at a CAGR of 27.57% to reach US$2, 797.556 million in 2028 from US$508.809 million in 2021.

During the projected period, the worldwide floating solar panels market is anticipated to benefit from an increased focus on clean fuel power generating energy sources as well as an inadequate supply of land. Regulatory bodies across the world are establishing several clean energy-related goals that will aid in reducing pollution.

Increasing Demand for Renewable Energy

It is anticipated that the technical component of floating solar technology will see a significant increase throughout the predicted time due to the increasing demand for reliable renewable energy sources for power generation. According to the data published by the National Energy Laboratory, the total installed FPV (Floating Photovoltaic) capacity worldwide in 2020 was around 2.6 GW, with the majority of this capacity being in China, the Taiwan region, and Japan (Cox 2021). The fast FPV expansion across Asia has been facilitated by a lack of available land, stringent renewable energy objectives, declining PV prices, and targeted subsidies.

Click here to read the full article
Source: Research and Markets

If you have any questions or thoughts about the topic, feel free to contact us here or leave a comment below.

Utility-scale solar generation is set to grow by 75% in just two years, pushed by the anticipated addition of 79 GW of new capacity.

Over the next two years, the United States will experience a remarkable acceleration in the energy transition in the electricity sector, according to new figures released the U.S. Energy Information Administration (EIA).

Utility-scale solar generation is set to grow by 75% in just two years, pushed by the anticipated addition of 79 GW of new capacity. The EIA described the increase as the “major driver” behind its electric sector power forecast, which expects generation from renewables — utility-scale solar, wind and hydro — to be almost twice the amount generated by coal in 2025.

Wind and solar are expected to account for 18.5% of all the electricity generated in the U.S., and hydro is anticipated to add another 6.5%. Wind and utility-scale solar by themselves will generate more power than coal in 2024.

Click here to read the full article
Source: Solar Builder

If you have any questions or thoughts about the topic, feel free to contact us here or leave a comment below.

US EIA forecasts new capacity will boost the solar share of total generation to 5.6% in 2024 and 7.0% in 2025, up from 4.0% in 2023.

We expect solar electric generation will be the leading source of growth in the U.S. electric power sector. In our January Short-Term Energy Outlook (STEO), which contains new forecast data through December 2025, we forecast new capacity will boost the solar share of total generation to 5.6% in 2024 and 7.0% in 2025, up from 4.0% in 2023.

The STEO includes two Between the Lines articles that discuss how our forecast for Brent crude oil prices performed in 2023 and a closer look at our Brent price forecast for 2024 and 2025. We expect U.S. crude oil and natural gas production growth to slow, but both continue to reach new records.

Click here to read the full article
Source: Clean Technica

If you have any questions or thoughts about the topic, feel free to contact us here or leave a comment below.

California has more solar capacity than any other state. California also generates the most geothermal electricity.

As the U.S. experiences more power outages, states are modernizing aging power grids with more sustainable alternatives. According to the Clean State Energy Alliance, 23 states currently have legislation that mandates cleaner energy. And with these shifts in infrastructure come business opportunities and reduced pollution.

To find where clean electricity is most prevalent – and to identify areas for potential upside – SmartAsset compared the amount of solar, wind, geothermal and nuclear operations as a percentage of a state’s entire electricity production capacity.

Click here to read the full article
Source: yahoo!finance

If you have any questions or thoughts about the topic, feel free to contact us here or leave a comment below.

The SEIA and Wood Mackenzie research group said the US solar sector is expected to add a record 33 GW of new generation capacity in 2023.

A new report from the Solar Energy Industries Association (SEIA) and the Wood Mackenzie research group said the U.S. solar sector is expected to add a record 33 GW of new generation capacity in 2023, a 55% increase from 2022.

The groups said that even with growth expected to slow over the next year due to economic and interconnection challenges, solar energy is expected to be the largest source of generating capacity on the U.S. power grid by 2050. The report released Dec. 7 said that government policies supporting solar power are among the reasons for the industry’s rise.

“Solar remains the fastest-growing energy source in the United States, and despite a difficult economic environment, this growth is expected to continue for years to come,” said SEIA president and CEO Abigail Ross Hopper. “To maintain this forecasted growth, we must modernize regulations and reduce bureaucratic roadblocks to make it easier for clean energy companies to invest capital and create jobs.”

Click here to read the full article
Source: POWER

If you have any questions or thoughts about the topic, feel free to contact us here or leave a comment below.

The US solar industry has registered its best third quarter ever with 6.5GW of PV installed in Q3 2023 but residential started slowing down.

The US solar industry has registered its best third quarter ever with 6.5GW of PV installed in Q3 2023, but residential started to show a slowdown in certain states.

According to research from the Solar Energy Industries Association (SEIA) and Wood Mackenzie, some of the biggest residential markets – such as Texas, Arizona and Florida – have experienced quarterly and annual declines in installed capacity in Q3 2023, despite a record number of installs with 210,000 systems.

Despite slowdowns in these major states, residential solar installed 1.8GW in Q3 2023, a 12% increase year-over-year and setting another quarterly record. During the first three quarters of the year, the segment is up 24% from the same period last year. In total, 34 states and Puerto Rico have had an annual growth during that period.

Click here to read the full article
Source: PV Tech

If you have any questions or thoughts about the topic, feel free to contact us here or leave a comment below.

In its latest monthly “Energy Infrastructure Update” report, FERC says solar provided 9,924 MW of new domestic generating capacity

A review by the SUN DAY Campaign of data newly released by the Federal Energy Regulatory Commission (FERC) and the U.S. Energy Information Administration (EIA) reveals that solar has grown faster in electrical generation than all other energy sources as well as outpaced them in new U.S. generating capacity added during the first three quarters of 2023.

In its latest monthly “Energy Infrastructure Update” report (with data through September 30, 2023), FERC says solar provided 9,924 MW of new domestic generating capacity or 42.4% of the total. Moreover, solar capacity additions during the first nine months of this year were almost a third (32.8%) larger than for the same period last year.

The new solar capacity additions edged past the 8,962 MW of new natural gas (38.2%) and were nine times greater than that provided by the new 1,100-MW Vogtle-3 nuclear reactor (4.7%) in Georgia as well as by oil (54 MW) and waste heat (31 MW).

Click here to read the full article
Source: Solar Power World

If you have any questions or thoughts about the topic, feel free to contact us here or leave a comment below.

Right now, the US has nearly 160 gigawatts of installed solar capacity, more than half of which is utility-scale.

The recipe for a fossil-free future includes a big dollop of solar — and in recent years, that solar has started popping up all around the U.S.

But where, exactly, are the country’s major solar installations located? The map below, created from the U.S. Large-Scale Solar Photovoltaic Database, shows the sites of ground-mounted solar installations in the country with a capacity of 1 megawatt or more. The most recent data available is current through the start of 2022, meaning even more solar is deployed across the country than is shown here.

Click here to read the full article
Source: Canary Media

If you have any questions or thoughts about the topic, feel free to contact us here or leave a comment below.