Right now, the US has nearly 160 gigawatts of installed solar capacity, more than half of which is utility-scale.

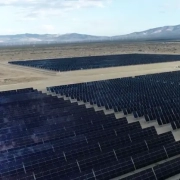
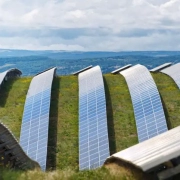
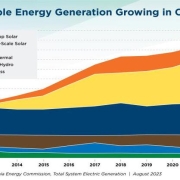
The recipe for a fossil-free future includes a big dollop of solar — and in recent years, that solar has started popping up all around the U.S.

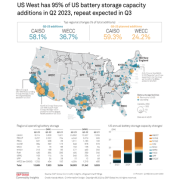
But where, exactly, are the country’s major solar installations located? The map below, created from the U.S. Large-Scale Solar Photovoltaic Database, shows the sites of ground-mounted solar installations in the country with a capacity of 1 megawatt or more. The most recent data available is current through the start of 2022, meaning even more solar is deployed across the country than is shown here.

Click here to read the full article
Source: Canary Media

If you have any questions or thoughts about the topic, feel free to contact us here or leave a comment below.

During the third quarter of 2023, renewables have installed a record 5.5GW of utility-scale renewable capacity, led by solar, according to ACP

During the third quarter of 2023, renewables have installed a record 5.5GW of utility-scale renewable capacity, led by solar, according to American Clean Power Association (ACP).

In its Clean Power Quarterly Market Report, ACP highlights that it is the strongest Q3 to date, which is up 13% over the same period in 2022. Solar continues to lead utility-scale installations with 3.1GW in the quarter, up from the 2.7GW added in the previous quarter and outpacing installations in 2022, while slightly behind numbers in 2021.

Click here to read the full article
Source: PV Tech

If you have any questions or thoughts about the topic, feel free to contact us here or leave a comment below.

Solar energy is on track to make up more than half of global electricity generation by the middle of this century.

In pursuit of the ambitious goal of reaching net-zero emissions, nations worldwide must expand their use of clean energy sources. In the case of solar energy, this change may already be upon us.

The cost of electricity from solar plants has experienced a remarkable reduction over the past decade, falling by 89% from 2010 to 2022. Batteries, which are essential for balancing solar energy supply throughout the day and night, have also undergone a similar price revolution, decreasing by the same amount between 2008 and 2022.

These developments pose an important question: have we already crossed a tipping point where solar energy is poised to become the dominant source of electricity generation? This is the very question we sought to address in our recent study.

Click here to read the full article
Source: The Conversation

If you have any questions or thoughts about the topic, feel free to contact us here or leave a comment below.

In 2022, around 10% of all new residential solar installations included paired storage — up from virtually zero in 2015.

Across the U.S. market, California “dominates” in sheer numbers of residential solar installations, according to LBNL. And 11% of those systems have attached storage, a trend Barbose said is driven in part by rebates for storage and by the California Public Utilities Commission’s Self-Generation Incentive Program.

However, system sizes in California only average 7.1 kW – “near the low end of the spectrum,” LBNL said, which pulls the U.S. median downward. While median system sizes in most states are “well above 8 kW, and in many states above 9 kW,” California’s overall share of the market means national median size is 7.2kW.

Click here to read the full article
Source: Utility Dive

If you have any questions or thoughts about the topic, feel free to contact us here or leave a comment below.

14 states produce the equivalent of 30% or more of their electricity consumption from wind, solar and geothermal, up from just two states in 2013.

In 2022, the United States produced more than three times as much solar, wind and geothermal power than we did in 2013, with growth in all 50 states. That’s according to Renewables on the Rise 2023, an online dashboard unveiled on Wednesday by Environment America Research & Policy Center and Frontier Group.

“Abundant and clean renewable energy sources, most notably wind and solar, are increasingly playing a leading role in how we power our lives,” said Johanna Neumann, senior director of Environment America Research & Policy Center’s Campaign for 100% Renewable Energy. “The sooner we power our lives with renewable energy, the better it will be for our health and our planet.”

Click here to read the full article
Source: Environment America

If you have any questions or thoughts about the topic, feel free to contact us here or leave a comment below.


US solar is growing at a breakneck speed, and it hit several big milestones in July, according to newly released government data.

In its latest monthly “Energy Infrastructure Update” report (with data through July 31, 2023) reviewed by the SUN DAY Campaign, the Federal Energy Regulatory Commission (FERC) says solar provided 1,824 megawatts (MW) of new US generation capacity, or more than 67.2% of the total added in July 2023. The balance (892 MW) was provided by natural gas. This brought solar’s share of total available installed generating capacity in the US up to 7.12%.

Click here to read the full article
Source: electrek

If you have any questions or thoughts about the topic, feel free to contact us here or leave a comment below.

For the six-month period, solar was 5.77% of total U.S. electrical generation. A year earlier, solar’s share was 4.95%.

Renewable energy sources provided 25.11% of the nation’s electrical generation in the first half of 2023, according to a SUN DAY Campaign review of data from the U.S. EIA. The latest issue of EIA’s “Electric Power Monthly” report shows that electricity from renewables is up slightly from the 25.06% reported for the first half of 2022.

Solar grew by 12.44%, compared to the same period in 2022. This was driven in large part by growth in “estimated” residential solar PV whose output increased by 25.59% — more than any other energy source — and accounted for nearly one-third (31.42%) of total solar production. For the six-month period, solar was 5.77% of total U.S. electrical generation. A year earlier, solar’s share was 4.95%.

Click here to read the full article
Source: Solar Power World

If you have any questions or thoughts about the topic, feel free to contact us here or leave a comment below.

Total US battery storage capacity soared 61% year on year to 12.689 GW by the end of the second quarter, Q3 is expected to see roughly 3.5 GW added.

Total US battery storage capacity soared 61% year on year to 12.689 GW by the end of the second quarter, but only about half of the expected facilities actually came online, as Q3 is expected to see roughly 3.5 GW added.

There was 1.931 GW of capacity added during Q2, an increase of 18% from Q1, according to an S&P Global Commodity Insights compilation of various government filings. The data includes facilities that either began commercial operation or were synchronized to the grid.

The California Independent System Operator leads the nation in battery storage capacity at 6.314 GW, or 47.8% of total US capacity, according to the data.

Click here to read the full article
Source: S&P Global

If you have any questions or thoughts about the topic, feel free to contact us here or leave a comment below.

New data from the SEIA on private investment suggests the law's subsidies for manufacturing and generation are significantly boosting industry activity levels.

The year since passage of the big climate law has brought over $100 billion in U.S. solar and storage company investments.

Why it matters: New data from the Solar Energy Industries Association — a major industry trade group — on private investment suggests the law’s subsidies for manufacturing and generation are significantly boosting industry activity levels.

  • The chart above shows how SEIA and the consultancy Wood Mackenzie see the law boosting power projects.

Click here to read the full article
Source: AXIOS

If you have any questions or thoughts about the topic, feel free to contact us here or leave a comment below.

Data from the CEC highlight California’s continued progress toward building a more resilient grid, achieving 100% clean electricity and meeting the state’s carbon neutrality goals.

Data from the California Energy Commission (CEC) highlight California’s continued progress toward building a more resilient grid, achieving 100% clean electricity and meeting the state’s carbon neutrality goals.

Analysis of the state’s Total System Electric Generation report shows how California’s power mix has changed over the last decade. Since 2012:

  • Solar generation increased nearly twentyfold from 2,609 gigawatt-hours (GWh) to 48,950 GWh.
  • Wind generation grew by 63%.
  • Natural gas generation decreased 20%.
  • Coal has been nearly phased out of the power mix.

Click here to read the full article
Source: Solar Power World

If you have any questions or thoughts about the topic, feel free to contact us here or leave a comment below.